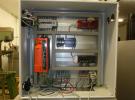
Hi, I am currently a student intern currently working on the T7-PRO. I have a encoder emulator as a digital input to the LJ, and I am trying to figure out how to use the digital input of the emulator as a potentiometer to create a variable speed to an analog output. I was just wondering if this was possible or worth the time to play around with. I know my question is somewhat vague, which also correlates to the knowledge I have behind these devices. Any help would be greatly appreciated.


.png%3Fitok=PHGBxf6M)


.jpg%3Fitok=B1YcuDFK)
.png%3Fitok=Ybt-OlgU)
Have you been able to measure the pulse frequency yet? I would enable a counter and see if you get counts. You can do this with the Register Matrix in Kipling:
datasheets/t7/digital-io/extended-features
https://labjack.com/support/
Let us know if you need more help with that.
Can you give us a feel for the range of pulses/second you expect?
How often do you want to update the DAC channel? For example, once per second you could read the change in count and update the DAC accordingly.
Any particular software plans? You could write a Lua script to do this right on the hardware itself, or could use DAQFactory as host-based software, or of course write a simple program in about any language.
t7-software-options
https://labjack.com/support/
Sorry for the confusion here; So I am actually trying to not physically have an output of the LJ, but rather find a software that can graph the pulses/second over time, which will correspond to the speed. I am basically using the emulator to represent the speed of a rollformer, and as I crank up the pulses/second on the emulator, I am looking to graphically see the analog output and relate this to another graph of the actual machine I am using this for. I pulled up the LJLogM and Stream, but I am not exactly sure if that will work with this application. Is there another software that will work for graphing the pulses/second from the emulator over time?
So we can use the proper frequency measurement technique, can you give us a feel for the range of pulses/second you expect, and how often you want to measure speed (e.g. once per second you read the average speed of the last second)?
https://forums.labjack.com/index.php?showtopic=1105
The range will max out at 16.67 pulses/second, and I would like to measure the speed every 10ms over a total time interval of 3 seconds.
If your max rate is 16.67 pps, you only get a pulse every 60 ms, so you can't measure speed every 10 ms.
I suggest you try using the Frequency In DIO-EF:
https://labjack.com/support/datasheets/t7/digital-io/extended-features/f...
Start by trying it in the Register Matrix in Kipling. You want to put 4 registers in the active list. Write a value to the first 3 and the 4th will read back period in seconds.
DIO_EF_CLOCK0_ENABLE = 1
DIO0_EF_INDEX = 3
DIO0_EF_ENABLE = 1
DIO0_EF_READ_A_F (reads the period of the signal)
If you want to save that configuration as the power-up default for your device, go to the Power-Up Defaults tab in Kipling. Then if you want to log the period to file you can go to LJLogM and put DIO0_EF_READ_A_F in any row.
This is what I have currently set up. I'm still unsure how to get the pulse/second over time graph, and how to wire the emulator to the T7. Any solutions?
So did you succeed in the stuff from post #6, or are you stuck before that?
Do you have the pulse signal connected to the T7, or do you need help with that?
Sorry for the confusion again, I had posted the picture before seeing post #6. After implementing post #6, I was able to get one graph that had reasonable results, but I have yet to get any results other than 0 since. As of post #7, I am just curious if that will be the correct connections between the emulator and LJ for what I am trying to achieve.
Your post seems to show Aout connected to T7-DAC0 and /Aout connected to T7-AIN0. That does not seem valid to me at all.
Is your pulse signal coming from Aout? If so, then my guess would be to connect Aout to T7-FIO0 and COM to T7-GND.
Awesome finally got a graph reading values thanks! Except now, as I increase the frequency, the value that DIO0_EF_READ_A decreases, where it shows on an O-scope that the value should increase. Also, is there a way to not have it auto-zoom in LogM? Thank you for your help!
Are you looking at the period? Period is the inverse of frequency.
Right-click on the y-axis and unselect "Autoscale Y".